
In statistics, an outlier is a data point that differs significantly from other observations in your dataset. It’s the number that stands apart, sometimes dramatically, from the rest of your data.
If you’re tracking your child’s quiz scores and they suddenly get a 45% after consistently scoring in the 80s and 90s, that low score is likely an outlier. Maybe they were sick that day, or perhaps they didn’t understand a new concept. Or picture this: you’re recording how many minutes your kids spend on math each day, and most days fall between 25 and 40 minutes, but one Tuesday they spent 180 minutes because they got completely absorbed in a geometry project. That 180 is your outlier.
Understanding outliers matters deeply in homeschooling because they tell you stories about your children’s learning that averages alone never will. When you’re evaluating whether your teaching approach is working, tracking progress for portfolio reviews, or deciding if your child needs extra support in a subject, outliers can signal important information or mislead you entirely.
The trick is knowing which outliers to pay attention to and which ones to set aside. A single unusual test score might reflect a bad day rather than a learning gap. A surprisingly high score might show genuine mastery or just a lucky guess on multiple choice questions.
This guide will walk you through what outliers really are, how to spot them using simple methods you can apply to your homeschool records, and most importantly, how to interpret them wisely so you make better decisions about your children’s education.
What an Outlier Means in Statistics
An outlier is a data point that differs significantly from other observations in your dataset. Think of it as the odd one out, the score, measurement, or number that makes you do a double-take because it just doesn’t fit the pattern you’re seeing everywhere else.
When you’re tracking your child’s work at home, you create datasets all the time without even realizing it. Maybe you’ve recorded your daughter’s spelling test scores over ten weeks, or you’ve timed how long your son takes to complete a math worksheet each day. Most of those numbers probably cluster together in a comfortable range. But then one day, you get a result that’s wildly different, maybe a spelling score of 4 out of 20 when she usually scores between 16 and 19, or a math worksheet that took 45 minutes when it typically takes 12 to 15. That unusual number is an outlier defined as an observation that lies an abnormal distance from other values in your sample.
- Outlier
- A data point that differs significantly from other observations in a dataset, standing apart from the typical pattern.
- Data point
- A single value or measurement in your collection of information, such as one test score or one reading time.
- Observation
- Another term for a data point, each individual measurement or result you record.
- Abnormal distance
- When a value sits unusually far from where most of your other measurements cluster, making it stand out as different.
Understanding outliers helps you make sense of the numbers you’re already collecting. You might track reading speeds, assignment completion times, or quiz results to understand patterns and progress. Looking at relative frequency shows you how often certain scores appear, but spotting outliers tells you when something exceptional has happened, whether that’s a breakthrough moment worth celebrating or a signal that something went wrong that day.
How Outliers Appear in Your Homeschool Data
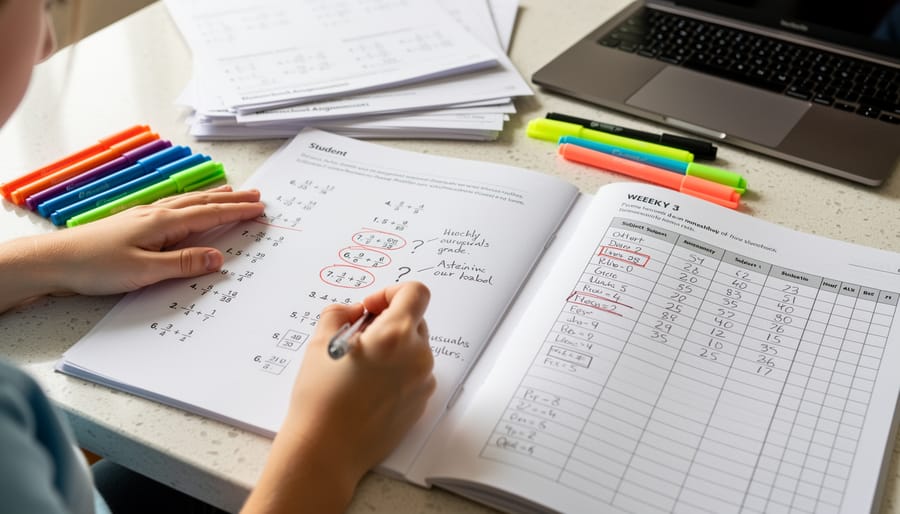
You’re recording your daughter’s daily reading speed, and for weeks she’s hovered between 85 and 95 words per minute. Then one day you note 45 words per minute, and the next day she’s back to 90. That 45 is an outlier, a number that sits far enough away from her usual range that it stands out immediately when you look at your log.
Outliers appear in homeschool data whenever a measurement falls notably outside the pattern you’ve been seeing. If your son consistently scores between 75 and 88 on his weekly math quizzes, a sudden 52 or a surprise 98 catches your attention because it doesn’t fit the cluster of his typical results. The key word is “abnormal distance.” Not every score needs to be identical, but outliers create a gap between themselves and the rest of your observations.
What makes that gap significant is what you need to figure out. Sometimes an outlier signals a real shift in your child’s understanding. That 98 might mean the concept finally clicked, or the 52 could reveal a fundamental misunderstanding you hadn’t noticed. Other times, the unusual number points to something outside the learning itself.
Common causes of outliers in homeschool settings include:
- Measurement mistakes, like timing a reading passage incorrectly or misreading a thermometer during a science experiment
- Exceptional performance days when your child is unusually focused or particularly distracted
- Data entry errors, such as writing 45 instead of 85 in your record book
- Genuine learning breakthroughs where a skill suddenly solidifies after weeks of practice
The difference matters because you respond differently to each cause. A recording error you simply correct. A breakthrough deserves celebration and maybe a harder challenge next week. A score that reveals confusion means you need to revisit that topic before moving forward. Natural variation from a tired morning or an exciting afternoon doesn’t require any action at all.
When you spot a number that feels off, your first job is asking whether it represents something real about your child’s learning or something else entirely. That question shapes whether you treat the outlier as useful information or just noise in your records.
Different Ways Outliers Show Up

Not every unusual number in your homeschool records means the same thing. Some outliers signal exciting breakthroughs, others point to struggles that need attention, and some just indicate you wrote down the wrong number. Knowing which type you’re looking at helps you respond appropriately instead of panicking over what might be a simple recording mistake.
Positive outliers are the exciting ones, they’re scores or measurements significantly higher than your child’s typical performance. If your daughter consistently reads 15-20 pages per sitting and suddenly finishes 45 pages one afternoon, that’s a positive outlier. Maybe the book finally clicked for her, or she hit a flow state, or the material was easier than usual. These outliers often reveal genuine progress or hidden strengths. When you spot them, look for patterns: was it a one-time thing, or the start of a new normal? That exceptionally high math test score might mean your child finally mastered fractions, not that they got lucky guessing.
Negative outliers work the opposite way. When your son who usually completes worksheets in 20 minutes takes 60 minutes one day, or scores much lower than normal on a science quiz, you’re seeing a negative outlier. These deserve attention but not alarm. Was he tired? Did he misunderstand the instructions? Is the material genuinely harder, or was there a distraction that day? A single low score often means nothing serious, but if you ignore it completely, you might miss an early signal that a concept isn’t clicking.
Measurement errors are the most common outliers in homeschool record-keeping, and they’re nobody’s fault, just human mistakes. You record 95 when your child scored 59. You count Wednesday’s math lesson twice. You accidentally log last week’s reading time in today’s column. These outliers don’t reflect your child’s actual performance at all. They’re just typos in your data, and once you spot them, you can correct them and move on without overthinking what they might mean.
Simple Methods to Identify Outliers

The Visual Check Method
The simplest way to spot outliers doesn’t require any math at all. Just look at your numbers. When I flip through my homeschool learning journal and see a week of spelling test scores like 85, 88, 90, 87, 92, 35, 89, that 35 jumps right off the page. That’s your visual check at work.
You can make this even clearer with a quick dot plot. Write your scores in order on a piece of paper and mark each one with a dot on a simple number line. If most dots cluster together in one area and you’ve got one or two sitting way off by themselves, those lonely dots are your outliers. It’s the scatter plot method teachers use, just simplified for kitchen table record-keeping.
Box plots work the same way but show you the middle chunk of your data in a box shape, with lines extending to the normal high and low points. Any dots sitting outside those lines are outliers. Most homeschool tracking apps and simple spreadsheet tools can create these for you automatically if you enter your data, though honestly, just eyeballing your list works fine for most daily situations. If a number looks wildly different from the others, it probably is.
The IQR Method Explained Simply
The IQR method sounds intimidating, but it’s just five simple steps you can do with a calculator. Let me walk you through it using a set of quiz scores: 74, 88, 78, 90, 94, 90, 84, 90, 98, and 80.
First, arrange the scores from lowest to highest: 74, 78, 80, 84, 88, 90, 90, 90, 94, 98. Now you can see the spread clearly.
Next, find the median of the lower half (Q1) and the upper half (Q3). With ten scores, the lower five are 74, 78, 80, 84, 88. The middle of that group is 80, so Q1 equals 80. For the upper five scores (90, 90, 90, 94, 98), the middle value is 90, making Q3 equal 90.
Subtract Q1 from Q3 to get the IQR: 90 minus 80 equals 10. This tells you the range where the middle half of your data lives.
Here’s where the fences come in. Multiply the IQR by 1.5 to get 15. Subtract that from Q1 (80 minus 15 equals 65) for your lower fence. Add it to Q3 (90 plus 15 equals 105) for your upper fence. These boundaries mark where normal variation ends.
Finally, check whether any scores fall outside the 65-105 example cutoff range. In this case, every score sits comfortably inside those fences, so there are no outliers.
The beauty of using 1.5 times the IQR is that it gives you objective boundaries instead of relying on gut feelings. When you track spelling test scores or math facts timing throughout the year, this method helps you identify which results genuinely stand out from your child’s typical performance.
When to Pay Attention to Outliers (and When Not To)
After calculating fences and identifying outliers, the real question becomes: what should you actually do with that information? I’ve tracked my own children’s work for years, and I’ve learned that context matters far more than the numbers themselves.
Pay close attention when an outlier appears repeatedly in the same subject. If your child consistently scores in the 90s on math tests but suddenly gets a 45, that’s worth investigating. Did they misunderstand the material? Were they feeling unwell that day? A single low outlier might just be an off day, but a pattern of them suggests something needs your attention, maybe the curriculum moved too fast, or the concept needs a different approach.
Celebrate the positive outliers, but don’t overreact to them either. When my daughter scored 100 on a writing assignment after weeks of 75-80 scores, it showed me what she was capable of when the topic genuinely interested her. That outlier helped me understand why statistics matter in homeschooling, they reveal patterns I might otherwise miss.
Sometimes you should ignore outliers completely. If your son normally reads a chapter book in four days but finished one in a single afternoon because he couldn’t put it down, that’s just enthusiasm, not a data problem. Similarly, if you accidentally recorded a score twice or wrote down the wrong number, just fix it and move on.
The key is asking whether the outlier tells you something useful about your child’s learning. Measurement errors and one-time flukes don’t deserve your energy. Real struggles or genuine breakthroughs do. Trust your judgment as a parent, you know your children better than any formula ever will.
Common Questions About Outliers
I know what you’re thinking as you look at that one wildly different score in your child’s math notebook, should you just cross it out? Let’s tackle the questions I hear most often from homeschooling families.
How do I know if I should throw out an outlier?
Don’t automatically discard it. First, investigate whether it’s a genuine mistake (like your child misread the question or you recorded the score wrong), a sign of something new (they suddenly grasped a concept or had an off day), or just normal variation in learning.
What if my child has lots of outliers?
Frequent outliers suggest inconsistent understanding or that your curriculum difficulty level might not match where your child is right now. It’s worth reviewing your homeschool planning to see if adjustments would help create more stable progress.
Do outliers mean I’m doing something wrong?
Not at all. Every learner has variation in their performance, and outliers are completely normal. They’re just data points that help you understand patterns, not judgments on your teaching.
Can outliers be good news?
Absolutely. A positive outlier might show your child finally clicked with a difficult topic, had extra motivation that day, or is ready to advance. These high points deserve celebration and investigation to see what worked well.
The real skill isn’t identifying which scores are outliers, it’s figuring out what they mean for your specific child. That unusually low score on Friday’s spelling test might reveal that your daughter was exhausted from staying up late reading, not that she doesn’t understand the word patterns. Context matters more than the number itself.
When you spot an outlier, treat it as a conversation starter with your child rather than a problem to fix. Ask what happened that day, how they felt about the work, whether something was confusing or surprisingly easy. You’ll learn far more from that five-minute chat than from any statistical calculation, and your child will see that you’re paying attention to their actual learning experience, not just chasing perfect scores.
Understanding outliers doesn’t require you to become a statistician overnight. It’s simply one more practical skill in your homeschooling toolkit, right alongside lesson planning and knowing when your child needs a break. You now know how to spot data points that stand out, check whether they’re mistakes or meaningful, and decide what action (if any) to take.
The real value isn’t in obsessing over every unusual quiz score. It’s in having the confidence to look at your records and see what’s actually happening. That unexpected low score might signal a concept that needs more attention. That surprisingly high result could mean your child finally clicked with a difficult topic and deserves celebration.
You’re already making informed decisions about your children’s education every single day. Recognizing outliers just gives you another way to see patterns, catch errors early, and understand where genuine breakthroughs are happening. Trust your observations, use the simple methods we’ve covered when you need them, and remember that the occasional odd result is perfectly normal. You’ve got this.