
Applied statistics and probability for engineers is a college-level course that teaches engineering students how to collect, analyze, and interpret data to solve real-world problems and make informed decisions under uncertainty. It bridges the gap between mathematical theory and practical application, equipping future engineers with tools to design experiments, assess product reliability, control manufacturing quality, and predict system performance.
If you’re homeschooling a student who’s shown an interest in STEM fields, this subject might seem intimidating at first. When my oldest started exploring engineering paths, I remember staring at course descriptions filled with terms like “hypothesis testing” and “regression analysis” and wondering how on earth we’d prepare for that at home. But here’s what I’ve learned: the foundation for this kind of thinking starts much earlier than college, and you’re probably already building it without realizing it.
At its core, this discipline teaches engineers to answer questions like “How likely is this component to fail?” or “Which design modification will actually improve performance?” rather than relying on guesswork. Students learn to work with probability distributions, confidence intervals, and statistical software to analyze data from testing and experimentation. Resources like Applied Statistics and Probability for Engineers (now in its 7th edition) and programs such as ISE Principles of Statistics for Engineers and Scientists available through McGraw-Hill’s Connect provide structured approaches to these methods, emphasizing practical problem-solving over pure mathematics.
The good news for homeschooling families is that you can start preparing your children for these concepts years before they encounter a formal statistics course. Building comfort with data, patterns, and logical reasoning during middle and high school creates a solid platform for tackling college-level engineering statistics with confidence.
What Applied Statistics and Probability for Engineers Really Means
At its heart, applied statistics and probability for engineers is the practical toolkit engineers use to make sense of uncertain, messy real-world data and turn it into reliable decisions. It’s not about abstract mathematical proofs or theoretical formulas that live only on chalkboards. Instead, it’s math put to work, helping engineers figure out if a new material will last, whether a production line is running consistently, or how likely a design is to fail under stress.
Let’s break down what that actually means. Statistics is the science of collecting, organizing, and interpreting data to spot patterns and draw conclusions. Probability is the mathematics of uncertainty, it helps us calculate how likely different outcomes are when we can’t predict exactly what will happen. When you combine these two and apply them to engineering problems, you get a powerful framework for answering questions like “Is this design safe enough?” or “What’s causing these quality defects?”
- Applied Statistics
- The use of statistical methods to analyze real data and solve practical problems, rather than studying statistics purely as an academic discipline.
- Probability
- The mathematical study of randomness and uncertainty, used to calculate the likelihood of specific outcomes or events occurring.
- Engineering Context
- The real-world scenarios where engineers must make data-driven decisions about safety, reliability, quality, and performance of systems or products.
- Statistical Methods
- Specific techniques and tools (like hypothesis testing, regression analysis, or control charts) used to extract meaningful information from data.
- Data Analysis
- The process of examining, cleaning, transforming, and interpreting data to discover useful patterns and support decision-making.
The key difference from pure mathematics is focus. Pure math explores concepts for their own sake. Applied statistics and probability for engineers, on the other hand, zeroes in on usefulness. Engineers need to test product reliability, control manufacturing quality, design experiments that yield clear answers, and assess risks. Courses like Applied Statistics and Probability for Engineers provide practical approaches appropriate for one-semester college courses, teaching students how to actually use these tools rather than just derive formulas. The emphasis is always on application, can you solve the problem in front of you?
For homeschooling parents, this matters because it reveals what your future engineer really needs: not memorization of every statistical formula, but the ability to think critically about data, recognize when numbers are trustworthy, and make informed choices despite uncertainty.
How This Subject Works in Practice

The practical work of applied statistics and probability in engineering follows a clear cycle that mirrors how engineers solve real problems. It starts with collecting data through measurements, tests, or observations. An engineer might record stress test results on bridge cables, track defect rates on an assembly line, or measure the lifespan of electrical components. The data collection phase requires careful planning to ensure measurements are accurate and representative of what you’re actually trying to understand.
Once you have data, the next step is analyzing patterns and calculating probabilities. Engineers look for trends, averages, and variation in their measurements. If 20 batches from a manufacturing process show increasing defect rates over time, that pattern signals a problem. If testing 500 light switches reveals that 2% fail before 10,000 cycles, probability calculations help predict failure rates for millions of units. This analysis transforms raw numbers into meaningful information about how reliable, safe, or efficient something actually is.
The critical phase is hypothesis testing and decision-making. Engineers use statistical methods to answer questions like: Is this new production method really better, or did we just get lucky with our sample? Can we confidently say this bridge design will handle the expected load? The math helps separate genuine improvements from random variation, which matters enormously when safety and money are on the line. Testing hypotheses means comparing what you observed against what you’d expect by chance alone, then deciding whether the evidence is strong enough to act on.
Real applications make this concrete. When testing bridge safety, engineers collect stress data from multiple points, calculate the probability of failure under different loads, and use statistical confidence levels to ensure public safety. In manufacturing, they might run experiments comparing production variables, analyze which changes genuinely improve quality, and implement controls based on evidence rather than guesswork.
For homeschooling families, recognizing this process matters more than mastering the formulas. When your child tracks plant growth under different conditions, measures and compares results, then draws conclusions, they’re following the same cycle professional engineers use. The thinking skills develop through hands-on projects where they collect real data, spot patterns, and make decisions based on evidence. That foundation builds gradually, starting with simple observations and growing into the sophisticated analysis that courses in applied statistics formally teach.
Core Topics Your Engineering-Minded Student Will Encounter
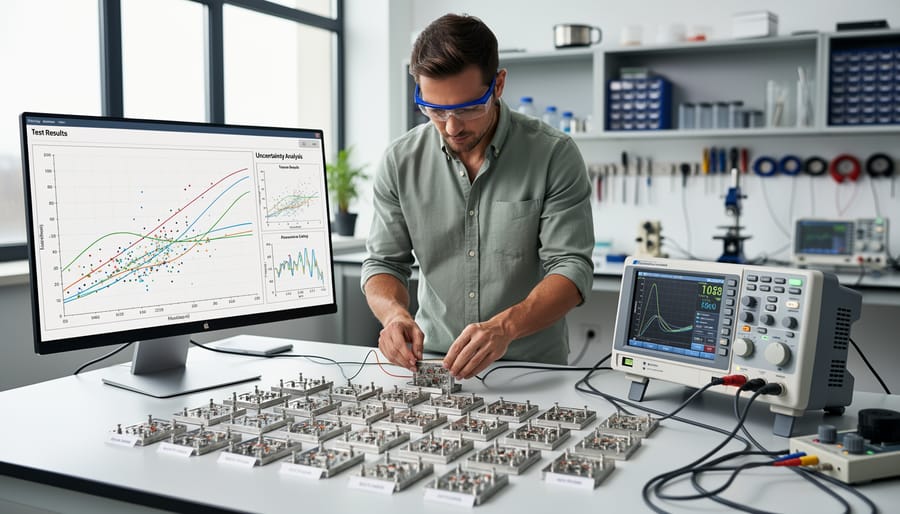
When your child eventually takes a college-level course in applied statistics and probability for engineers, they’ll encounter several interconnected topics that build on each other. Understanding what’s ahead helps you recognize early opportunities to introduce these concepts through homeschool activities, long before formal coursework begins.
The major areas your engineering-minded student will study include:
- Descriptive statistics, summarizing and visualizing data through means, medians, and graphs
- Probability theory, calculating likelihoods and understanding randomness
- Sampling and data collection, gathering representative information efficiently
- Hypothesis testing, determining whether observed patterns are statistically significant
- Regression and correlation, identifying relationships between variables
- Design of experiments, planning tests that yield reliable results
- Statistical quality control, monitoring processes to maintain standards
Descriptive statistics teaches students how to organize and summarize data meaningfully. Engineers use measures like mean and median to characterize product dimensions or performance metrics, and they learn to find outliers that might signal manufacturing defects. You can introduce these ideas early by having your child track daily temperatures, calculate averages, and create simple bar graphs from their observations.
Probability distributions form another cornerstone. Students learn how events distribute across possible outcomes, whether analyzing the likelihood of component failure or predicting traffic patterns. Courses like ISE Principles of Statistics for Engineers and Scientists and STAT 2800U Statistics and Probability for Engineers cover these relevant topics, though specific curriculum details vary by program. At home, dice games and coin-flip experiments naturally demonstrate probability concepts without requiring advanced math.
Hypothesis testing sounds complicated, but it’s essentially asking whether a difference you observe is real or just random variation. If one manufacturing process produces stronger materials than another, hypothesis testing confirms whether that’s genuinely better or simply luck. Homeschoolers can practice this thinking by comparing plant growth under different conditions and discussing whether observed differences seem meaningful.
Regression analysis identifies how variables relate to each other. Does temperature affect reaction time? Does study duration correlate with test scores? Understanding relative frequency and patterns in data helps students predict outcomes and optimize processes. Even tracking how practice time affects musical improvement introduces regression thinking.
Design of experiments and quality control methods teach systematic approaches to testing and monitoring. Engineers plan experiments to isolate variables and use statistical charts to catch problems before they become failures. These practical applications make abstract formulas meaningful, showing why the math matters in real-world engineering work.
Where Engineers Actually Use These Skills
Engineers depend on statistical methods every single day, often in ways that keep us safe without our even realizing it. When a medical device company tests a new heart monitor, they use probability distributions and reliability analysis to ensure it won’t fail during critical moments. Construction firms assess risk by analyzing soil samples, weather patterns, and material stress data before breaking ground on a bridge or high-rise, making decisions that could mean the difference between a structure that stands for generations and one that collapses. Environmental engineers examining water quality collect samples over time, apply hypothesis testing to identify contamination trends, and use regression analysis to predict how pollutants spread through ecosystems.
Manufacturing facilities rely heavily on quality control techniques like control charts and design of experiments to catch defects before products reach customers. An automotive engineer might analyze thousands of brake test results to determine failure rates and set appropriate safety margins. Aerospace teams use probability models to assess component reliability, calculating the odds that a part will perform correctly under extreme conditions over its expected lifespan. Chemical engineers optimize production processes by designing experiments that test multiple variables simultaneously, finding the perfect temperature, pressure, and mixture ratios that maximize yield while minimizing waste.
For homeschooling parents, this might sound intimidating, but here’s the encouraging truth: every time your child measures ingredients for a recipe and notices how small changes affect the outcome, or tracks their basketball free-throw percentage over a week and spots improvement patterns, they’re developing the same observational and analytical thinking that underlies these professional applications. Understanding real-world statistics starts with curiosity about patterns and accuracy in everyday projects, not complex equations.
Preparing Your Homeschooler for College-Level Engineering Statistics

You don’t need to become a statistics expert yourself to prepare your child for engineering-level math. The foundation for understanding applied statistics and probability starts years before college, built through everyday curiosity and hands-on exploration. I remember when my own son was about eight, fascinated by measuring how fast his toy cars rolled down ramps at different angles. We started recording times, comparing results, and talking about why some attempts were faster than others. That simple backyard experiment planted seeds for statistical thinking that grew into genuine confidence with data years later.
Start with data collection projects that feel like detective work rather than math drills. Weather tracking offers natural opportunities: measuring daily rainfall, recording temperatures, and looking for patterns across weeks or months. Plant growth measurements turn gardening into science, where your child charts how different conditions affect results. Even household surveys about favorite dinner choices or time spent on various activities introduce the concept that numbers tell stories about real life. The key is making observation and measurement a regular part of your homeschool planning woven naturally into projects your child already enjoys.
Probability thinking develops beautifully through games and experiments. Board games with dice teach fundamental concepts about likelihood and chance. Card games introduce combinations and outcomes. Simple coin-flipping experiments, where you predict and then test what actually happens over many trials, demonstrate how probability works in practice. Cooking together offers ratio work and measurement precision. These activities feel like play, but they’re building the exact thinking patterns engineers use when assessing risk or predicting outcomes.
- Elementary ages: Sorting collections by attributes, counting and comparing groups, simple measurement activities, pattern recognition games
- Middle school: Science fair projects with data collection, graphing results from experiments, analyzing sports statistics, tracking personal metrics
- High school: Introductory statistics courses, online resources and video lessons, dual enrollment at community colleges, practice with real datasets
Encourage the question “why” behind every number. When your child sees a graph, ask what story it tells. When you encounter percentages in news articles, discuss what they really mean. This curiosity about interpreting data matters more than memorizing formulas. When the time comes for formal college-level study, resources like Applied Statistics and Probability for Engineers (available in its 7th Edition and through platforms like McGraw-Hill’s Connect) provide structured instruction. But those courses build on years of informal statistical thinking you’re cultivating right now, one measurement and one question at a time.
Common Questions About Engineering Statistics in Homeschooling
I hear from homeschooling parents all the time who feel overwhelmed when their teens start showing serious interest in engineering. The questions pour in: What exactly will they need to learn? Do I have to become a statistics expert? When do we even start?
Let me address the most common concerns I’ve encountered over the years.
What topics are covered in statistics and probability for engineers?
The core curriculum typically includes descriptive statistics, probability distributions, hypothesis testing, regression analysis, design of experiments, and quality control methods. Courses like Applied Statistics and Probability for Engineers, 7th Edition cover these topics in a one-semester format appropriate for college engineering students.
Do I need to be good at math to teach this?
No. Your role is to support and encourage, not to become the instructor. When your child reaches college-level content, resources like McGraw-Hill’s Connect for ISE Principles of Statistics for Engineers and Scientists provide structured instruction, practice problems, and automated feedback that don’t require you to master the material yourself.
When should my child start learning statistics?
Foundation-building can start surprisingly early through data collection activities, simple graphing, and probability games in elementary years. Formal statistics courses typically come in high school or early college, but the thinking patterns develop gradually across childhood.
Is this subject necessary for all engineering paths?
Yes, it’s foundational across engineering disciplines. Whether your child pursues mechanical, electrical, civil, chemical, or environmental engineering, they’ll need to analyze data, assess uncertainty, and make evidence-based decisions using statistical methods.
The resource question deserves more detail because it’s where parents often feel stuck. You have several solid pathways. College textbooks like Applied Statistics and Probability for Engineers provide comprehensive coverage with a practical approach to probability and statistical methods. Online platforms offer structured courses with interactive elements. Community colleges frequently allow dual enrollment for advanced high schoolers, giving access to proper instruction without the pressure of a full university course load.
One mom told me recently that she worried about “ruining” her daughter’s engineering chances by not teaching statistics perfectly. I reminded her that homeschooling’s flexibility is actually an advantage here. Your student can work through foundational concepts at their own pace, building genuine understanding rather than racing through standardized timelines. The courses like STAT 2800U and Principles of Statistics for Engineers and Scientists will be there when they’re ready, emphasizing how statistical methods apply to real engineering problems.
Your job isn’t to deliver college-level instruction. It’s to nurture curiosity, provide opportunities, and connect your child with appropriate resources when the time comes.
Applied Statistics And Probability For Engineers might sound like one of those intimidating course titles that makes you wonder if you’re qualified to guide your child toward a STEM future. But here’s what I’ve learned through my own homeschooling journey: the heart of this subject isn’t about mastering complex formulas or memorizing statistical tables. It’s about teaching kids to observe patterns in the world around them, understand that uncertainty is normal and manageable, and make thoughtful decisions based on evidence rather than guesswork.
Those are life skills, not just engineering skills.
You don’t need to become a statistics expert to nurture these abilities in your children. What matters is creating space for curiosity. When your daughter asks why her plant grew faster near the window, that’s data observation. When your son estimates how many tries it’ll take to land a beanbag in the basket, that’s probability thinking. These everyday moments build the foundation that later supports college courses in applied statistics.
The beauty of homeschooling is watching your children’s unique strengths emerge in their own time. Some kids will devour statistical concepts early. Others will circle back to them later when they discover a passion that needs those tools. Trust the process, provide the opportunities, and remember that supporting a future engineer starts with believing in their potential, not perfecting your own math skills.
Your encouragement matters more than your equations ever could.