
The interquartile range (IQR) is a measure of statistical spread that captures the middle 50% of your data set. It’s calculated by subtracting the first quartile (Q1, the 25th percentile) from the third quartile (Q3, the 75th percentile). Unlike the range, which gets thrown off by a single outlier, the IQR gives you a reliable picture of where most of your data actually lives.
If you’re teaching statistics at home, you’ve probably discovered that math concepts stick better when kids can see why they matter. The IQR isn’t just another formula to memorize. It’s the tool that helps us understand test scores, compare sports statistics, and make sense of scientific data without getting distracted by extreme values that skew the picture.
This article walks you through what the IQR really measures, how to calculate it step by step, and why it’s one of the most practical statistics tools your student will use. I’ll show you how the quartiles work together to paint a clearer picture than averages alone can offer, and where this concept shows up in real-world analysis. Whether you’re brushing up on statistics yourself or preparing to guide your teen through data analysis, you’ll find the IQR is more approachable than it first appears.
What IQR Means in Plain Language

Think of the interquartile range as the middle slice of your data sandwich. When you line up all your numbers from smallest to largest, the IQR shows you where the middle half lives.
Here’s what that means in practice. Say your daughter tracks her weekly spelling test scores over eight weeks: 65, 72, 78, 82, 85, 88, 91, 95. The IQR tells you the spread between the score at the 25% mark and the score at the 75% mark. It ignores that one rough week (the 65) and that stellar performance (the 95), focusing instead on where most of her typical scores fall.
- IQR (Interquartile Range)
- The spread of the middle 50% of your data, calculated by subtracting Q1 from Q3.
- Q1 (First Quartile)
- The 25th percentile, the point where one-quarter of your data falls below and three-quarters fall above.
- Q2 (Second Quartile)
- The median or 50th percentile, the exact middle value when data is arranged in order.
- Q3 (Third Quartile)
- The 75th percentile, the point where three-quarters of your data falls below and one-quarter falls above.
- Statistical Dispersion
- A measure of how spread out or scattered your data points are from each other.
The simple formula states that IQR equals Q3 minus Q1 giving you a single number that describes your data’s typical range without getting thrown off by oddball values. This matters because data rarely behaves perfectly. Kids don’t score identically every week, grocery bills vary, and understanding that middle range helps you see patterns that actually matter rather than getting distracted by extremes.
How IQR Works: Breaking Down the Numbers
Understanding Quartiles
Think of quartiles as dividing lines that split your data into four equal groups, just like cutting a sandwich into four pieces. When you line up all your numbers from smallest to largest, these dividing lines mark where each quarter ends and the next begins.
Q1 (the first quartile) sits at the 25% mark. That means a quarter of your data falls below this number. Q2 is the median, landing right in the middle at 50%. Half your numbers are below it, half above. Q3 (the third quartile) marks the 75% point, with three-quarters of your data below it.
Here’s a helpful way to explain it to your kids: imagine 20 students lined up by test score. Q1 would be the score of the 5th student (25% of 20), Q2 would be between the 10th and 11th students (the middle), and Q3 would be the 15th student’s score.
Q1 and Q3 are percentiles that capture specific positions in your ordered data. Once you’ve identified these three markers, you’ve essentially mapped out where most of your data lives, which makes understanding IQR much simpler.
The Simple Formula
The formula itself couldn’t be simpler: IQR = Q3 – Q1. That’s it. You’re taking the third quartile and subtracting the first quartile.
Let’s make this real with test scores. Say your child took ten quizzes and earned these scores (already in order): 65, 70, 72, 75, 78, 80, 82, 85, 88, 90.
First, find Q1, the score at the 25th percentile. That’s 72, the value where a quarter of the scores fall below it. Next, find Q3, the 75th percentile, which is 85. Three-quarters of the scores sit below this point.
Now subtract: 85 – 72 = 13. The IQR is 13 points.
What does that tell you? The middle half of all quiz scores spread across 13 points. Most scores cluster within that range. It’s a snapshot of where the typical performance falls, ignoring both the best and worst outliers.
When I first taught this to my kids, I had them use their own video game scores. Suddenly the formula wasn’t abstract anymore. They could see exactly where their usual performance landed.
Why IQR Is Useful (and Why It Beats Other Measures)

Here’s where IQR really shines: it tells you where most of your data actually lives, without getting thrown off by weird extremes. When your child tracks their reading times for a week and one day they read for three hours straight (maybe a sick day at home?), that outlier won’t skew the IQR the way it would mess up the average or range.
Think about a practical example your kids can relate to. Say they’re recording daily high temperatures for a month. Most days fall between 68 and 78 degrees, but one freak cold snap drops to 45 degrees. The range (the difference between the highest and lowest values) now looks massive, suggesting wild temperature swings when really most days were pretty consistent. The IQR ignores that one oddball day and shows the typical temperature variation they actually experienced.
This resistance to extremes makes IQR particularly valuable when you’re working with real-world data, which almost always has a few quirky values. Understanding what is an outlier helps kids see why we need measures like IQR that aren’t fooled by them.
The IQR also works beautifully with skewed data. When your homeschooler tracks something like weekly page counts from their book club and the numbers cluster low but occasionally spike when they finish a short book, the IQR captures the typical reading pattern without being dragged upward by those few high-count weeks. Standard deviation, by contrast, treats every data point equally and can give a misleading picture of spread when the data isn’t symmetrical.
Teaching IQR in Your Homeschool: A Parent’s Approach
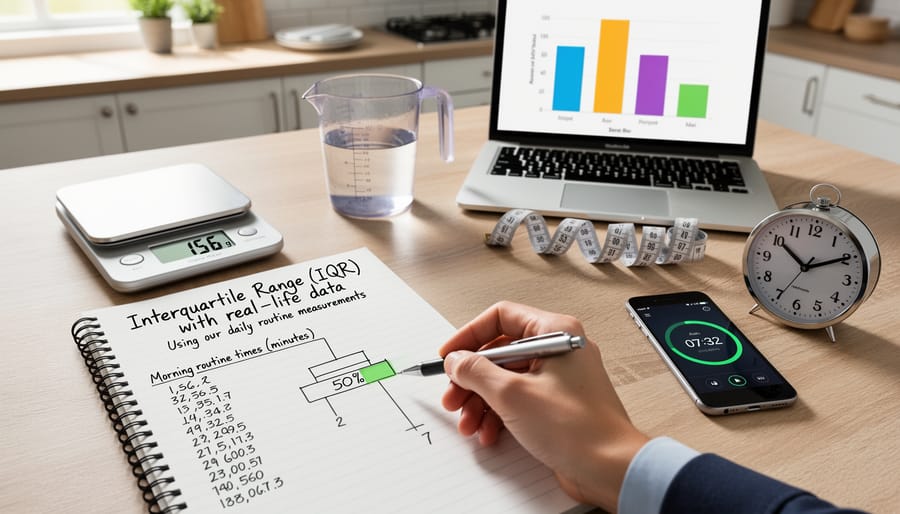
Teaching statistics at home used to intimidate me. I remember the first time my daughter encountered IQR in her middle school math curriculum, and I realized I’d need to relearn it myself before I could help her understand it. That moment of panic turned into one of my favorite homeschool wins.
Most homeschoolers encounter IQR somewhere between seventh and ninth grade, depending on the math program. It typically appears after students have worked with mean, median, and mode, and have some comfort with fractions and decimals. If your student has already explored relative frequency they’re probably ready for IQR.
The secret to teaching IQR successfully is making it tangible before introducing any formula. I started by having my kids track real data from our lives for a week, then physically arranging those numbers to find the quartiles. Here are activities that worked beautifully in our homeschool:
- Tracking weekly grocery expenses and finding which middle half of shopping trips cost
- Recording scores from board game nights to see the typical range of performance
- Measuring daily growth of seedlings in our garden
- Comparing afternoon temperatures over two weeks
- Timing how long morning routines take each day
The physical aspect matters enormously. We wrote each data point on an index card, spread them on the kitchen table, and literally divided them into four groups. My daughter could see and touch the quartiles. Only after she understood what was happening did we write down the formula.
I also learned not to rush through this concept. Traditional schools often speed past IQR in a single lesson, but homeschooling gives you the flexibility to spend three or four days playing with real data before formalizing the process. Let your student become the expert on their own dataset. When they can explain why the middle 50% matters using their own examples, you’ll know the concept has stuck.
Build understanding first, formulas second. That approach has never failed us in math.
Common Questions About IQR
Here’s a truth I’ve learned from years of homeschooling: kids ask questions right when you’re least prepared to answer them. That’s especially true with statistics concepts like IQR. Here are the questions parents and students ask most often, with straightforward answers you can actually use.
What is the interquartile range?
The interquartile range (IQR) is the difference between the third quartile (Q3) and the first quartile (Q1) of a dataset, showing you the spread of the middle 50% of your observations. It’s a measure of how spread out the central portion of your data is, ignoring the extreme highs and lows.
How do you calculate interquartile range?
You calculate IQR using the simple formula IQR = Q3 – Q1. First, arrange your data in order, find Q1 (the 25th percentile) and Q3 (the 75th percentile), then subtract Q1 from Q3 to get your answer.
Why is the IQR useful?
IQR is particularly valuable because it’s resistant to extreme observations that can throw off other measures. When you’re looking at test scores or household data and a few wild outliers don’t represent the typical pattern, IQR gives you a reliable picture of where most values actually fall.
What grade level learns IQR?
Most students encounter IQR in middle school math, typically around 6th or 7th grade when they’re studying data analysis and descriptive vs inferential statistics. The beauty of homeschooling is that you can introduce it whenever your child is ready to understand quartiles and subtraction.
One question that deserves extra attention: how is IQR different from range? Range is simpler, just the highest value minus the lowest, but it’s heavily influenced by outliers. If one student scores 0% on a test while everyone else scores between 70% and 95%, the range makes the data look more spread out than it really is. IQR focuses on that middle 50% where most scores actually landed, giving you a much more accurate sense of the typical spread.
Think of it this way: range tells you about the extremes, while IQR tells you about the reality most people experience. That’s why statisticians often prefer it for real-world data analysis.
You can absolutely teach IQR at home, even if statistics wasn’t your strongest subject. The key is focusing on understanding, not just memorizing the formula. When your kids grasp that IQR shows where most of the data lives, not just the extremes, they’ve learned something genuinely useful.
Track your family’s real data: grocery spending, daily temperatures, pages read each week. Calculate the IQR together. Let them see how outliers don’t throw off the middle range the way they distort a simple average. That hands-on experience sticks far better than any worksheet.
This is the beauty of homeschooling math. You don’t need to rush through chapters or teach concepts before your kids are ready. You can spend an afternoon playing with real numbers, building genuine statistical thinking. Trust yourself. You’re giving them something textbooks often miss: the why behind the math, taught at exactly the right pace.