Relative frequency in statistics is the proportion or percentage of times a specific value appears in a dataset compared to the total number of observations. Instead of simply counting how many times something occurs, relative frequency shows you what fraction of the whole each occurrence represents.
If you’ve ever helped your child track how often they practiced piano each week or counted the types of birds visiting your backyard feeder, you’ve already worked with frequency. But relative frequency takes that raw count and transforms it into something more meaningful: context. It answers the question “what part of the total does this represent?” rather than just “how many times did this happen?”
I’ll be honest. When I first encountered relative frequency while planning math lessons for my kids, I thought it sounded more complicated than it actually is. The beauty of this concept lies in its simplicity and usefulness. Whether you’re organizing data from a science experiment, analyzing survey results from your homeschool co-op, or helping your student understand probability, relative frequency gives you a clear picture of patterns and proportions.
This matters for homeschooling parents because statistics isn’t just abstract math. It’s a practical life skill your children will use constantly, from understanding news reports to making informed decisions. And unlike some statistical concepts that require advanced algebra, relative frequency builds naturally on basic division and percentages, making it perfect for middle school learners and beyond.
In this guide, I’ll walk you through exactly what relative frequency is, how to calculate it step by step, the different ways you can display it, and real situations where you’ll actually use it. You’ll see how this fits beautifully into literacy-based planning especially when your students are working with data from their own observations and experiments. No confusing jargon, just straightforward explanations that will have you teaching this concept with confidence.
What Relative Frequency Means (In Plain Language)
Think of relative frequency as answering the question: “Out of everything we counted, what slice of the pie does this piece represent?” It’s a way to show not just how many times something happened, but what portion or percentage it makes up of the whole picture.
When you track data at home, say, recording which subjects your child gravitates toward each day, you start with simple counting. If your daughter picked math as her favorite subject three times in one week, that’s the frequency: the raw number of times it occurred. But relative frequency takes it a step further. It shows that those three days represent three out of seven total days, or about 43 percent of the week. Suddenly, you’re not just counting, you’re seeing the pattern.
Here’s how the two differ:
- Frequency
- The number of times a particular value or event occurs in your data set. If you count five fiction books out of ten books read, the frequency of fiction is five.
- Relative Frequency
- The proportion or percentage that a particular frequency represents out of the total. Those five fiction books become 0.5 or 50 percent of all books read.
- Frequency Distribution
- An organized display showing how often each value appears, either as raw counts or as percentages of the whole.
Why does this matter? Because real-world data rarely comes with context built in. When you read that 12 homeschoolers in your co-op prefer hands-on science projects, that number means little until you know there are 15 families total. The relative frequency, 80 percent, tells the real story.
This shift from “how many” to “what portion” helps your children understand surveys, compare options, and make sense of statistics they’ll encounter everywhere from sports scores to news reports. You’re teaching them to see the bigger picture, not just isolated numbers.
How Relative Frequency Works in Practice
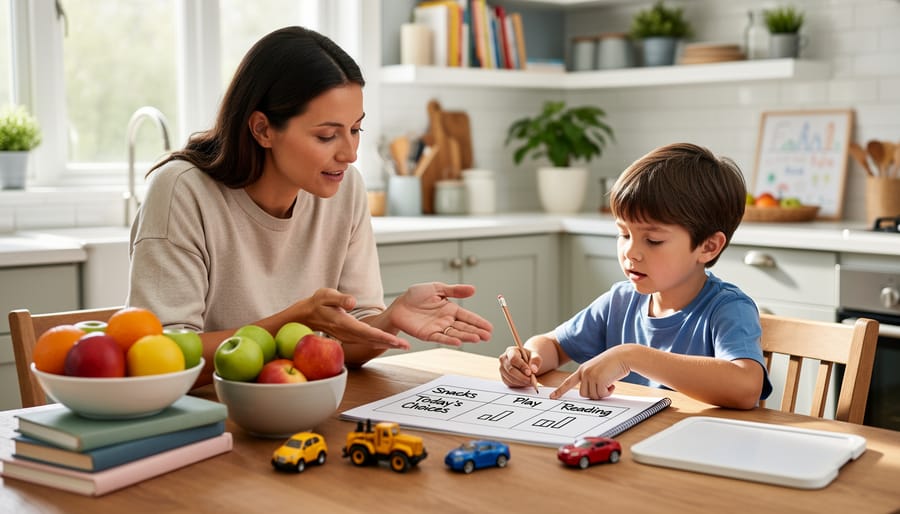
Let’s say your daughter tracks what she reads for a month. She finishes 20 books total: some were fiction, some nonfiction, and a few were graphic novels. You want to figure out what portion of her reading was fiction. That’s where relative frequency comes in.
Here’s the simple three-step process you’ll follow together.
First, count how many times the thing you’re tracking actually happened. In this case, maybe your daughter read 12 fiction books out of those 20. That number, 12, is called the frequency.
Second, count your total observations. You’re looking at 20 books altogether, so that’s your total.
Third, express the first number as a fraction or percentage of the total. Divide 12 by 20, and you get 0.6. Multiply by 100, and that’s 60%. Your daughter spent 60% of her reading time on fiction. That percentage is the relative frequency.
Let me show you another example that makes the pattern even clearer. Imagine surveying 20 families on your street about how many cars each household owns. You knock on doors and write down the answers: 1, 2, 1, 0, 3, 4, 0, 1, 1, 1, 2, 2, 3, 2, 3, 2, 1, 4, 0, 0.
Now count how many families said they have one car. You tally them up and find eight families. That’s your frequency for “1 car.” Your total observations are still 20 households. Divide 8 by 20, and you get 0.4, or 40%. So 40% of the families you surveyed own one car.
You can do this for every answer: zero cars, two cars, three cars, four cars. Each time, you’re taking that specific count and seeing what slice of the whole picture it represents.
The beauty of this approach is that you don’t need a math degree to guide your child through it. You’re just organizing information you already collected and asking, “What part of the total does this make up?” Whether you’re tracking daily chores completed, favorite lunch choices for the week, or how often science experiments succeed on the first try, the steps stay the same. You count the occurrences, count the total, then calculate the percentage. That’s it.
Different Ways to Show Relative Frequency
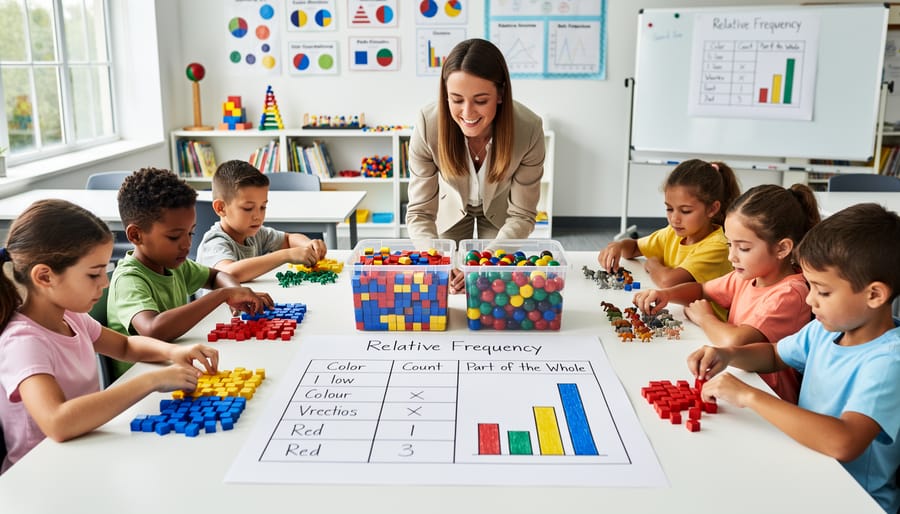
Once you’ve collected data in your homeschool, whether it’s tracking reading genres, counting science experiments, or noting which subjects your child gravitates toward during free choice time, you’ll want to organize it so the patterns become clear. Relative frequency data can be displayed in several formats, and choosing the right one depends on what you’re tracking and what story you want the numbers to tell.
The most straightforward option is a frequency table, which lists each category or value alongside how many times it occurred. If you surveyed your homeschool co-op about preferred field trip destinations and got 15 votes for the science museum, 8 for the art gallery, and 12 for the nature center, a frequency table would simply show those counts. A relative frequency table takes it one step further by converting those counts into percentages or fractions of the whole, so you’d see that 43 percent chose the science museum, 23 percent the art gallery, and 34 percent the nature center. That percentage view often makes comparisons easier, especially when you’re presenting findings to other families or using the data for homeschool planning decisions.
Here are the main formats you’ll encounter:
- Frequency tables: show actual counts for each category, useful when raw numbers matter most
- Relative frequency tables: display percentages or fractions, making it easier to compare proportions across groups
- Bar charts: visual representations that let you see patterns at a glance, especially helpful for younger learners
- Histograms: similar to bar charts but used for numeric data grouped into ranges, like test scores in 10-point intervals
Both categorical data (subjects, book genres, activity types) and numeric data (quiz scores, pages read per day, minutes spent on math) work with frequency distributions. When you’re dealing with continuous numeric variables like height measurements or time spent on assignments, you’ll need to create class intervals, grouping the data into ranges like 0-10 minutes, 11-20 minutes, and so on, because listing every single value would become unwieldy. Whether you choose a table or a chart often comes down to your audience: tables work well for detailed record-keeping, while visual charts help children grasp the big picture quickly and make data feel less intimidating.
Why Homeschoolers Should Care About Relative Frequency

Understanding relative frequency isn’t about preparing for some distant future or checking off a homeschool requirement. It’s about giving your children a lens to make sense of the world they’re already navigating.
When I started tracking which subjects my kids gravitated toward during free learning time, I wasn’t trying to be a data scientist. I just wanted to understand their natural interests. Over two months, I noticed my daughter chose art projects 15 out of 30 days. That relative frequency of 50% told me something important: she wasn’t just dabbling, she was consistently drawn to creative work. That insight shaped how I structured her curriculum going forward, giving art equal weight rather than treating it as an afterthought.
This is why statistics matters in homeschooling. Relative frequency helps you see patterns in your own teaching approach. Which methods are working most often? What percentage of history lessons end with genuine engagement versus glazed eyes? You’re not just guessing anymore.
Your kids encounter data constantly. Sports statistics, weather forecasts, news reports about health trends, social media engagement metrics. When they understand relative frequency, they can ask better questions. If a headline screams that a risk doubled, they can wonder: doubled from what? What’s the actual proportion? That’s critical thinking in action.
For test preparation, relative frequency shows up in probability questions and data interpretation passages. But more importantly, it trains children to think proportionally about information rather than being swayed by raw numbers that lack context.
Survey results make more sense through this lens too. If 200 people prefer option A and 50 prefer option B, the relative frequencies (80% versus 20%) tell the real story about preference distribution.
This isn’t abstract math living in a textbook. It’s a practical tool your children will use to navigate information, make decisions, and understand their own learning patterns throughout their lives.
Common Questions About Relative Frequency
What is relative frequency in statistics?
Relative frequency is the proportion or percentage of times something happens compared to all possible occurrences. While frequency tells you how many times something occurred, relative frequency shows what portion of the total that represents, making it easier to compare data and understand patterns.
How do you calculate relative frequency?
Count how many times your outcome occurs, then divide that number by the total number of observations. You can express the result as a fraction, decimal, or percentage, whichever makes the most sense for your child’s understanding.
When should I use relative frequency instead of regular frequency?
Use relative frequency when you want to compare different groups or understand what portion of the whole each outcome represents. For example, if you’re comparing your child’s reading habits to national averages, percentages make more sense than raw counts.
What age is appropriate to introduce this concept?
Most children can grasp basic relative frequency ideas around ages 9-11, when they’re comfortable with fractions and percentages. Start with simple everyday examples like “What fraction of your books are fiction?” and build complexity as they grow.
The beauty of teaching relative frequency at home is that you can tailor the pace and examples to your child’s interests. If they’re fascinated by sports, track batting averages. If they love nature, count bird species at your feeder and calculate what percentage each represents. You don’t need expensive materials or formal training, just curiosity and everyday data from your homeschool life.
You don’t need a statistics degree to teach your children about relative frequency, you just need to start noticing the patterns already happening in your homeschool day. As we’ve explored throughout this article, relative frequency simply helps us understand what portion or percentage of the whole each outcome represents, turning raw numbers into meaningful insights. Whether you’re tracking which subjects your kids gravitate toward, analyzing how often they choose outdoor activities, or reviewing test results, you’re already working with the data you need.
Start small. Pick one simple thing to track this week, maybe reading genres, math problem types, or even snack preferences, and walk through the process together. Count the occurrences, find the total, calculate the percentages. You’ll be surprised how quickly your children grasp the concept when it’s rooted in their own experiences rather than abstract textbook problems. These data literacy skills will serve them far beyond your homeschool years, helping them navigate everything from news articles to personal finance decisions.
Remember, teaching statistics at home isn’t about perfection, it’s about curiosity and exploration. If you’re new to homeschooling and feeling overwhelmed by subjects like this, our homeschooling starter guide offers practical support for building confidence across all subject areas. You’re equipping your children with tools to make sense of the world around them, one percentage point at a time. That’s powerful stuff.