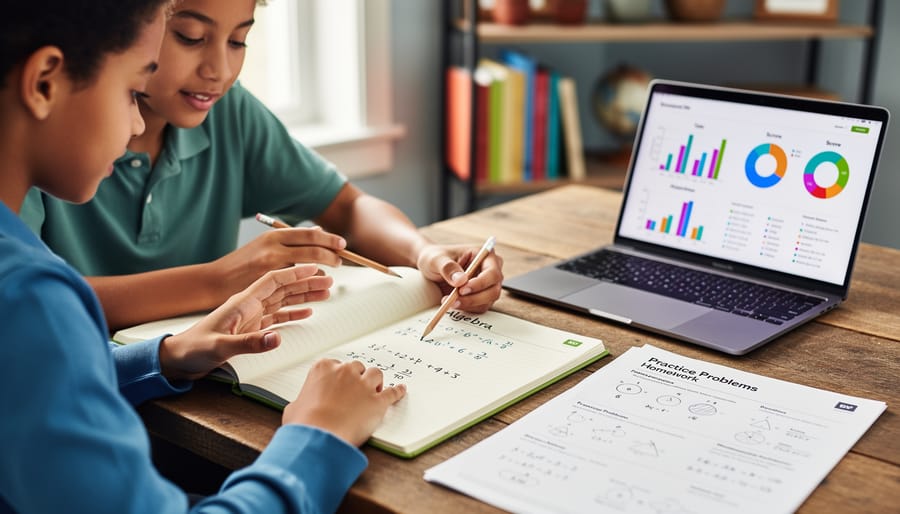
Most homeschooling parents supporting a student through upper-level math or science need descriptive statistics far more often than inferential statistics, but understanding both helps you choose the right courses and know when your child is genuinely ready for college-prep data analysis.
Here’s the essential difference: descriptive statistics help you organize and summarize information you already have (think calculating your child’s average test score or creating a bar chart of weekly spelling results), while inferential statistics use sample data to make predictions or draw conclusions about a larger group (like estimating how all students might perform based on a small study group). For homeschooling families, descriptive statistics show up constantly in everyday teaching, from tracking progress to visualizing patterns in your child’s work. Inferential statistics, though, typically enter the picture later, when your student tackles advanced placement courses, prepares for college-level research, or explores fields like psychology, economics, or science.
I’ve watched countless parents panic when they see “statistics” on a high school transcript requirement, assuming it means complex formulas and probability theory their student isn’t ready for. The truth is simpler. Most intro statistics courses, including those designed for teens, spend significant time on descriptive methods before touching inference. Simon Fraser University’s Spring 2026 STAT 203 course, for instance, covers both descriptive and inferential statistics but starts with scales of measurement and descriptive techniques. The University of Toronto’s LHA1006H similarly builds from univariate and bivariate descriptive statistics before introducing sampling and statistical inference, often using accessible tools like Excel or SPSS that students can learn at home.
Understanding which type of statistics your child actually needs, and when, helps you avoid unnecessary stress and choose curriculum that matches their developmental stage and academic goals.
At a Glance: Descriptive vs. Inferential Statistics
Before we dive deeper into these two statistical approaches, here’s a quick snapshot of how they differ. I’ve organized the key distinctions in a way that makes it easy to see which method fits where you are in your homeschool math journey.
| Feature | Descriptive Statistics | Inferential Statistics |
|---|---|---|
| Purpose | Summarize and organize data you already have | Make predictions or conclusions about larger groups from sample data |
| Typical Use | Create charts, calculate averages, show patterns in your dataset | Test hypotheses, estimate population characteristics, predict outcomes |
| Complexity Level | Beginner-friendly, concrete and visual | Intermediate to advanced, more abstract reasoning |
| Math Prerequisites | Basic arithmetic, understanding of mean/median/mode | Solid algebra skills, probability concepts, sampling theory |
| Homeschool Example | Tracking your child’s weekly reading minutes and finding the average | Using your family’s test results to predict how similar homeschoolers might perform |
This breakdown gives you a practical starting point. Most homeschoolers begin with descriptive statistics because it builds naturally on the math skills they already have. Inferential statistics comes later, once students are comfortable working with data and ready to ask bigger questions about what their numbers might reveal.
What Descriptive and Inferential Statistics Actually Are
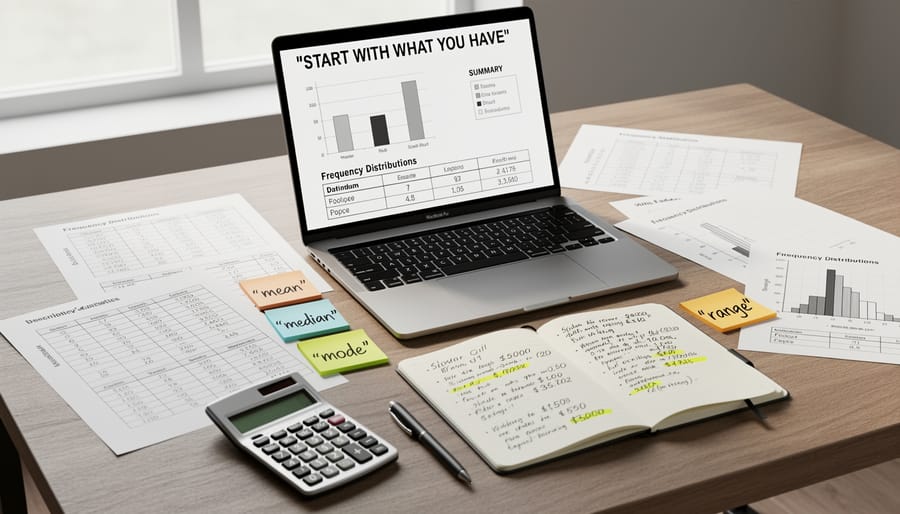
Descriptive Statistics: Organizing What You See
Descriptive statistics is about making sense of the information right in front of you. When your child tracks reading minutes each week, logs quiz scores in a notebook, or records how many seeds sprouted in a science experiment, they’re collecting data. Descriptive statistics gives them tools to organize and summarize those numbers so patterns emerge and the data tells a story.
Think of it as answering, “What did we actually observe?” rather than, “What might happen next?” Your homeschooler calculates the average (mean) of their spelling test scores over a month, identifies which score appears most often (mode), or finds the middle value when all scores are arranged in order (median). These measures, mean, median, and mode are the backbone of descriptive statistics and help students see central tendencies at a glance.
Beyond calculating averages, descriptive statistics includes creating charts and graphs. A bar chart showing daily exercise minutes or a pie chart breaking down time spent on different subjects makes data visual and easier to understand. Students also learn about range (the spread between highest and lowest values), relative frequency (how often something occurs as a proportion), and finding outliers that don’t fit the usual pattern.
The beauty of descriptive statistics is its immediacy. Your child uses only the data they’ve gathered, with no need to predict or generalize. It builds confidence through concrete results and lays the foundation for more advanced statistical thinking.
Inferential Statistics: Making Educated Guesses Beyond Your Data
Inferential statistics takes your understanding beyond what’s directly in front of you. Instead of just summarizing the data you have, inferential statistics lets you draw conclusions about a much larger group based on a smaller sample. Think of it this way: if you surveyed 50 homeschool families in your co-op about their reading habits, inferential statistics would help you estimate whether those patterns likely hold true for thousands of homeschoolers across your state or the entire country.
This approach involves generalizing from sample to population using mathematical probability. Your child might encounter this when analyzing whether a new teaching method truly makes a difference or predicting the likelihood of certain outcomes. For example, if you’re wondering whether homeschoolers generally score higher on standardized tests, inferential statistics would help you test that question using data from a representative sample rather than needing to test every single homeschool student.
The key concepts here include sampling (choosing a group that represents the larger population), hypothesis testing (asking whether observed patterns are real or just random chance), and confidence levels (how certain you can be about your conclusions). It sounds complex, but many Canadian university courses like Simon Fraser’s STAT 203 OL01 teach these concepts to social science students, showing they’re accessible with the right foundation.
Your homeschooler uses inferential thinking when they wonder “Will this study strategy work for other students?” or “Is this pattern I noticed actually meaningful?” Those questions move beyond describing what happened to predicting what might happen next.
How They Compare: Key Differences That Matter for Homeschoolers

Purpose and Goals
When you pick up descriptive statistics, you’re answering “what happened?” You’re taking data you already have, maybe your child’s quiz scores over a semester or the number of pages read each week, and summarizing it so the numbers make sense at a glance. Think means, medians, charts. The goal is clarity: turning a messy pile of information into something organized that tells you the story of what’s right in front of you.
Inferential statistics asks a different question: “what can we predict or conclude beyond this data?” Instead of just describing what you collected, you’re using a sample to make educated guesses about a larger group. For example, if you surveyed twenty homeschool families about their math curriculum choices, inferential methods help you estimate what hundreds of families might choose. You’re testing ideas, making predictions, and drawing conclusions that stretch beyond your immediate dataset. It’s less about summarizing and more about reasoning forward.
Data Requirements and Scope
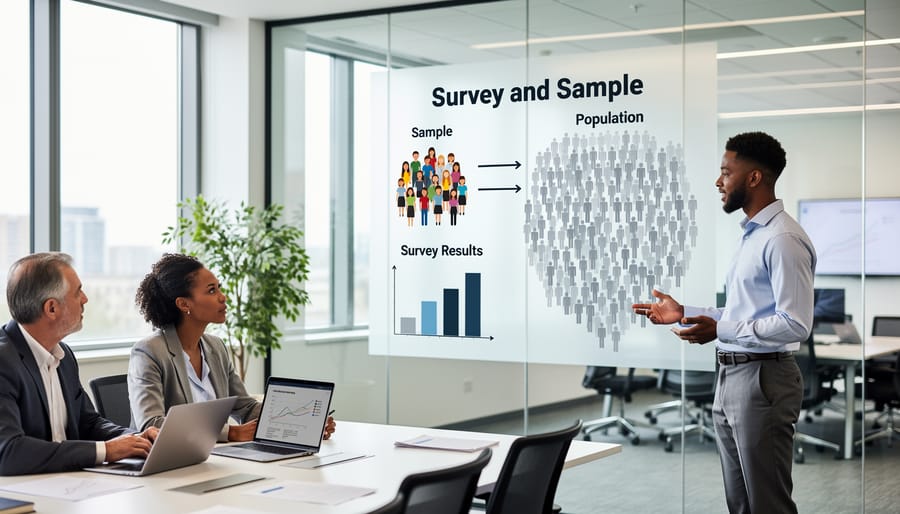
The data you need changes everything about which statistical approach works for your homeschooler.
Descriptive statistics works with complete datasets you already have in front of you. Your child’s test scores from the past semester, the daily temperature readings they recorded for a science project, or the number of pages read each week, these are finite, known sets of information. You’re not trying to guess or predict beyond what you’ve collected. You have all the data points, and your student’s job is to organize and summarize them clearly. Think of it as working with a finished puzzle: every piece is there, and you’re just arranging them to see the picture.
Inferential statistics flips this completely. Here, your homeschooler works with a sample, a small, representative slice of a much larger group they can’t fully measure. They might survey twenty homeschool families in your co-op to draw conclusions about homeschoolers across your state, or test a dozen plant samples to make predictions about an entire garden bed. The goal is making educated guesses about populations too big or impractical to study entirely. It’s like examining a few puzzle pieces and trying to figure out what the whole picture shows.
This distinction matters when you’re planning curriculum. If your child struggles with abstract thinking, stick with descriptive work where the boundaries are clear and complete.
Math Skills and Prerequisites
The math foundation for descriptive statistics is relatively gentle. Your student needs basic arithmetic, addition, subtraction, multiplication, and division, plus a solid grasp of how averages work. If they can calculate a mean, understand what a median represents, and interpret simple charts, they’re ready to start organizing and summarizing data. This is why descriptive methods often appear in middle school curricula, where students learn to make sense of information they’ve already collected.
Inferential statistics demands considerably more preparation. Students need comfort with algebraic thinking, including variables and equations, because they’ll work with formulas that predict outcomes. Probability concepts become essential, understanding likelihood, randomness, and how samples relate to larger populations. University courses like Toronto’s LHA1006H introduce sampling and statistical inference after covering descriptive foundations, reflecting this natural progression. If your homeschooler hasn’t tackled probability or algebra yet, stick with descriptive work until those skills develop. The jump to inferential methods makes much more sense once the mathematical scaffolding is firmly in place.
Tools and Software Used
The tools you’ll use differ by complexity. Descriptive statistics works beautifully with simple spreadsheets and basic calculators. Your homeschooler can track science experiment results in Google Sheets or create charts in Excel using functions like AVERAGE and MEDIAN. Many families start with free tools like Google Sheets or LibreOffice Calc before moving to anything specialized.
Inferential statistics demands more sophisticated software. University courses like LHA1006H at the University of Toronto teach students to learn to use Excel or SPSS for hypothesis testing and probability calculations. SPSS is powerful but expensive and complex for beginners.
For homeschoolers ready to explore inferential methods, consider starting with free alternatives. R and RStudio offer professional-grade capabilities at no cost, though they have a learning curve. Jamovi provides a user-friendly interface built on R that’s perfect for teens learning sampling and basic inference. Khan Academy’s statistics modules include interactive tools that let students experiment with both descriptive summaries and inferential concepts without downloading software.
Match the tool to your child’s current skills, not their eventual destination.
Real-World Applications
You’ve already used descriptive statistics if you’ve ever tallied up how much you spent on curriculum this year or calculated your child’s average quiz score. These real-world statistics help families see patterns in data they already have. A parent tracking reading minutes per week, charting growth measurements, or summarizing completed assignments is doing descriptive work. Students use it when they organize survey results from a co-op group or graph their science experiment outcomes.
Inferential statistics comes into play when you need to make predictions beyond your immediate data. A homeschooler researching college admissions might look at sample acceptance rates to estimate their own chances. Families deciding whether a new curriculum works well often informally test it with one child before committing for all siblings. Even predicting whether your student will finish a course on schedule based on their current pace involves inferential thinking, taking what you know now and projecting forward to what’s likely.
Where Your Homeschooler Will Encounter These Concepts
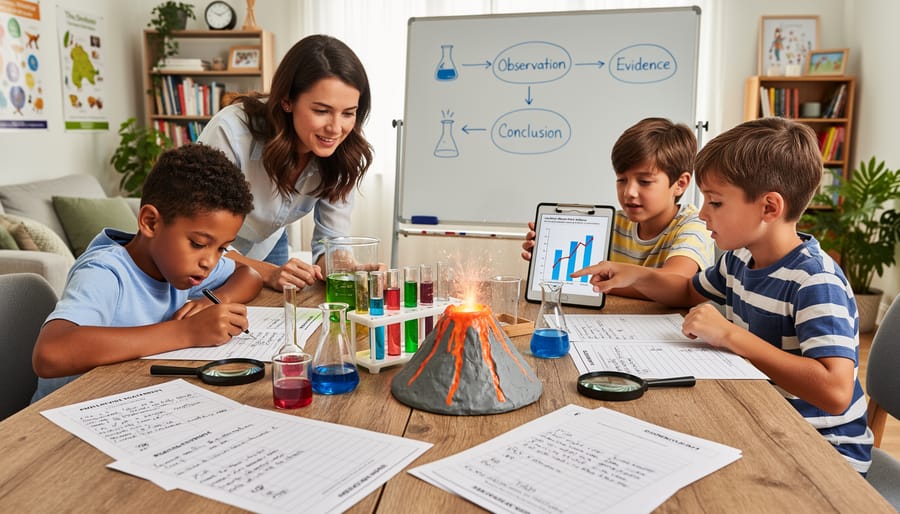
Your homeschooler will bump into descriptive and inferential statistics far more often than you might expect. These concepts show up across math curricula, standardized tests, science projects, and even everyday research tasks. Understanding where they appear helps you plan when and how to introduce them.
Most formal math courses introduce descriptive statistics first, typically in middle or early high school. Your student will learn to calculate means, create histograms, and interpret data tables. Inferential statistics usually enters the picture in advanced high school courses or college-level classes. Simon Fraser University’s STAT 203 OL01, offered in Spring 2026, covers both descriptive and inferential statistics for social science students, showing how universities structure this progression. The University of Toronto’s LHA1006H takes a similar approach, teaching univariate and bivariate descriptive statistics before moving into sampling, experimental design, and statistical inference.
Homeschoolers encounter these concepts in multiple contexts:
- Math curricula that include data analysis and probability units
- Science fair projects requiring data collection, analysis, and conclusions
- Social studies research involving surveys, polls, and demographic data
- College prep courses, especially AP Statistics
- Standardized tests like the SAT, ACT, and state assessments that include data interpretation questions
The University of Toronto course teaches students to use Excel or SPSS software for statistical analysis, reflecting how statistics has become increasingly computational. Even if you’re not replicating a full university course at home, knowing these tools exist can guide your software choices.
Statistics Canada offers events and training sessions where participants explore how data is collected, analyzed, and used to inform decisions. These free resources can supplement your homeschool curriculum with real-world applications and Canadian data examples. My daughter attended one virtually and came away excited about how statistics shapes public policy, which made the abstract concepts suddenly feel relevant and important.
Which Approach Is Right for Your Student?
Start Here: When Descriptive Statistics Is the Right Fit
If your child hasn’t learned fractions, percentages, or basic algebra yet, descriptive statistics is where you want to camp out for a while. This is the foundation, the place where students learn to make sense of numbers they can see and touch.
I’ll never forget the afternoon my daughter spread her weekly reading log across the kitchen table, frustrated that she “never reads enough.” We grabbed some colored pencils and turned those daily minutes into a simple bar chart. Suddenly she could see her week: four solid days above her goal, two slower days, one sick day. That’s descriptive statistics in action, taking raw numbers and organizing them so they tell a clear story.
Your student is ready for descriptive statistics if they can add, subtract, and understand what an average means. They don’t need probability theory or hypothesis testing. They just need curiosity about patterns and the patience to organize information carefully.
This approach fits students who are building confidence with numbers, anyone working on science fair projects that involve measurements, or teens who want to understand their own data, sports stats, spending habits, test scores over time. It’s also perfect for visual learners who grasp concepts better through charts and graphs than through abstract formulas.
The beauty of starting here is that every skill transfers forward. When your child eventually encounters inferential statistics, they’ll already know how to organize data, spot outliers, and present findings clearly. You’re not skipping ahead; you’re building a solid base that makes everything else easier.
Ready for More: When to Introduce Inferential Statistics
Your student is ready for inferential statistics when they’ve built a solid math foundation and want to do more than just describe what they see in data. This is the step where they start making predictions, testing ideas, and drawing conclusions that reach beyond their immediate observations.
Look for these signs of readiness: your teen can comfortably work with algebraic expressions and functions, understands basic probability concepts like fractions and percentages, and has already mastered the descriptive statistics fundamentals covered in the previous section. Students preparing for Advanced Placement exams or planning science-focused college paths need inferential methods. If your homeschooler has expressed interest in conducting research projects, analyzing survey results, or exploring how scientists draw conclusions from experiments, they’re showing the curiosity that drives inferential thinking.
Formal statistics courses structure this progression deliberately. Simon Fraser University’s STAT 203 course, offered in Spring 2026, moves students through scales of measurement and descriptive statistics before advancing to inferential techniques aimed at social science applications. The University of Toronto’s LHA1006H course follows a similar path, teaching univariate and bivariate descriptive statistics first, then introducing sampling, experimental design, and statistical inference. Students in LHA1006H also learn Excel or SPSS software, which helps them handle the computational complexity.
My daughter made this transition during her sophomore year, after spending months getting comfortable with charts and averages. Once she could look at a dataset and instinctively calculate means and create graphs, she was ready to ask bigger questions about what patterns might mean for situations beyond her sample.
The Best Path: Using Both Together
Here’s the reality: you won’t get far teaching one without the other. Descriptive statistics gives your student the foundation, how to organize, summarize, and visualize data clearly. But once they’ve mastered those basics, inferential methods show them how to draw meaningful conclusions and make predictions from what they’ve collected.
Think of it like learning to cook. You start by following recipes exactly (descriptive), then you develop the judgment to adjust seasonings and substitute ingredients based on what you know works (inferential). Real data analysis requires both skills working together, universities structure their courses this way for good reason, building from descriptive techniques to inference as students gain confidence with the material.
Your homeschooler doesn’t need to master everything at once. Start with the descriptive tools, let those become second nature, then layer in the inferential concepts when the timing feels right.
What Each Option Is
Before we dive into which approach fits your homeschooler, let’s nail down what we’re actually talking about. I’ve found that half the confusion parents face with statistics comes from fuzzy definitions, so here’s the plain-English breakdown.
Descriptive statistics is about summarizing and organizing data you already have in front of you. Think of it as taking a pile of information, test scores from last semester, daily reading minutes your child logged, temperatures you measured in a backyard science experiment, and turning it into something you can actually understand. You calculate averages, create charts, find the highest and lowest values, and present the numbers in ways that make patterns obvious. You’re not making predictions or drawing conclusions beyond what the data directly shows. You’re simply describing what’s there.
Inferential statistics goes a step further. It uses a sample of data to make educated guesses about a larger group you didn’t measure. Say your homeschool co-op surveys 30 families about their math curriculum preferences, then uses those responses to predict what the broader homeschool community might prefer. Or a researcher tests 100 students to draw conclusions about all students. Inferential statistics involves probability, hypothesis testing, and calculating how confident you can be in those predictions. It’s about making the leap from “what we observed” to “what we can reasonably expect in the bigger picture.”
Who Should Choose Which
Choose descriptive statistics if your homeschooler is building foundational math skills, working through middle school curriculum, or just beginning to explore data concepts. This approach works beautifully for students who need concrete, hands-on practice organizing information, like tracking weekly reading minutes or charting plant growth in science experiments. It’s the right starting point if your child finds abstract thinking challenging or responds better to visual learning with charts and graphs.
Switch to inferential statistics when your student has mastered basic descriptive methods and shows readiness for algebra-level thinking. This fits teens preparing for college-level coursework, students aiming for AP exams, or learners who ask “what if” questions about data patterns. If your homeschooler plans to pursue science research or college programs like Simon Fraser’s STAT 203 OL01, they’ll need inferential skills.
For parents feeling overwhelmed by these choices, starting with a beginner-friendly resource like statistics for dummies can clarify which path matches your child’s current abilities. Most families find success by introducing descriptive methods first, then layering in inferential concepts as confidence grows, there’s no rush to do both simultaneously.
Common Questions About Teaching Statistics at Home
Do I need to understand statistics myself to teach it at home?
Not at expert level, but you should stay one step ahead of your student. Many homeschool parents learn alongside their children using textbooks, online courses, or resources like Statistics Canada’s training sessions that help you explore how data is collected and analyzed. The key is being comfortable admitting when you need to learn something together.
What age should we start teaching statistics?
Simple descriptive statistics like counting, sorting, and making basic charts can start as early as age 8 or 9. Most students tackle formal descriptive statistics around ages 12-14, while inferential statistics typically comes in high school once they have solid algebra skills.
Are there free or affordable resources for teaching statistics at home?
Yes, many options exist. Statistics Canada offers events and training sessions that help families understand data analysis. Khan Academy provides free statistics lessons, and your library likely has statistics textbooks. For students ready for college-level work, some universities offer online courses that your homeschooler might audit.
How do I know if my child is ready for inferential statistics?
Look for mastery of descriptive statistics first, can they calculate means, create graphs, and interpret data summaries confidently? They also need comfort with basic probability and algebra, since inferential statistics relies heavily on both. If those foundations are solid, they’re ready to move forward.
Beyond these common questions, parents often worry about whether statistics is truly necessary for every homeschooler. The honest answer is that while not every student needs advanced inferential methods, basic descriptive statistics appears everywhere in adult life. Reading news articles, comparing product reviews, managing household budgets, and tracking fitness goals all require understanding how data is summarized and presented. Even if your child doesn’t pursue a STEM career, these skills build critical thinking and help them spot misleading claims.
If you’re feeling overwhelmed about where to start, remember that statistics education builds incrementally. University courses like the University of Toronto’s LHA1006H introduce statistics gradually, starting with descriptive methods before moving to inference, and teaching practical tools like Excel or SPSS along the way. You can follow the same progression at home, beginning with simple data collection projects, tracking daily reading minutes, recording weather patterns, or analyzing family spending, and gradually adding complexity as confidence grows.
The beauty of homeschooling statistics is that real-life data is everywhere. You don’t need fancy software or expensive curricula to teach your child how to organize information, spot patterns, and draw reasonable conclusions. These practical applications of applied statistics make the concepts stick far better than abstract textbook problems ever could. Start with questions your child actually cares about, use data they can see and touch, and build from there. Statistics taught this way becomes a tool they’ll use for life, not just a subject to check off a list.
Understanding the difference between descriptive and inferential statistics doesn’t need to feel overwhelming. Descriptive statistics helps your child make sense of data they already have, organizing it, summarizing it, finding patterns. Inferential statistics takes that foundation and builds on it, teaching them to make predictions and draw conclusions that reach beyond their immediate dataset. Both matter, but they serve different purposes at different stages of learning.
The beauty of teaching statistics at home is that you can meet your child exactly where they are. If they’re just starting to explore data, descriptive methods give them concrete, confidence-building wins. Once they’ve mastered those basics and have the algebra skills to support it, inferential approaches open up new ways of thinking about the world around them.
Remember, statistics isn’t just something that lives in textbooks or college courses. It’s how we make informed decisions every day, from comparing prices to evaluating claims we hear in the news. When your homeschooler learns these skills, they’re gaining tools that will serve them well beyond any test or assignment.
Start small. Celebrate when your child successfully creates their first chart or calculates an accurate mean. Notice when they begin questioning whether a sample represents a larger group. These moments matter. Math mastery isn’t about racing through concepts, it’s about building genuine understanding, one thoughtful step at a time. You’re equipping your child with real thinking skills, and that’s worth celebrating.